.svg) National Institute of General Medical Sciences |
 |
|
National Biomedical Resource for |
| ACERT's Service and Collaborative Projects | ||
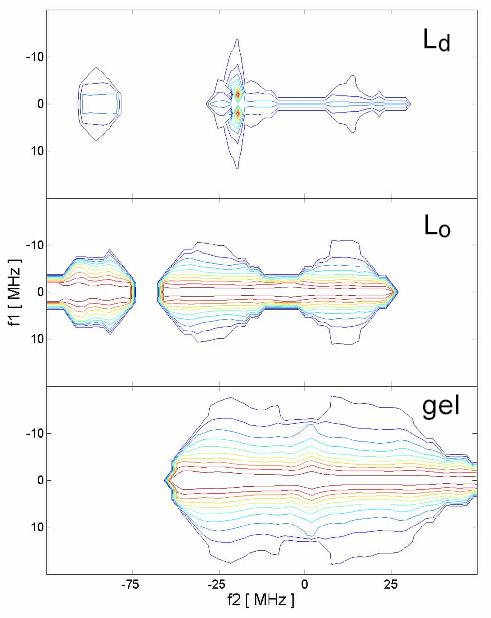
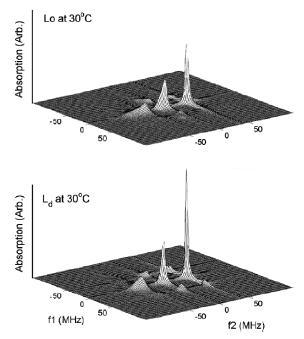
In recent years it has been shown that 2D-ELDOR experiments on spin-labeled lipids in membranes provide much greater spectral resolution to dynamics and ordering in these complex fluids than do cw-ESR spectra. In previous 2D-ELDOR studies, the magnitude spectra were used. This is because imperfect spectral coverage from pulses of finite widths and finite spectrometer deadtimes lead to spectral phase shifts with respect to both frequency dimensions, which distort the spectra. The magnitude spectra, however, are not affected by such phase shifts. But, as is well-known, magnitude spectra significantly reduce the spectral resolution, so it would be desirable to overcome this issue. The new “full Sc- method” that we have developed is applicable to 2D spectra for any arbitrary admixture of homogeneous and inhomogeneous broadening. The “full Sc- method” utilizes both the real and imaginary components of the experimental 2D-ELDOR signal, and it includes the phase corrections as additional fitting parameters in the non-linear least-squares fitting of theory to experiment. This provides much greater sensitivity in the fitting than the much broader magnitude spectra, which had previously been used. Since the fitting also yields the phase corrections one can then use them to produce pure absorption spectra from the original experimental data, which are helpful for further visual analysis. In one application, we have been able to obtain the phase diagram of 1,2 dipalmitoyl-sn-glycero-phosphatidylcholine (DPPC) - cholesterol binary mixtures vs. temperature. This phase diagram has regions corresponding to liquid-disordered(Ld)liquid-ordered (Lo), and gel phases. The 2D-ELDOR spectra from the 16-PC spin label are very distinctive for these phases, especially in the absorption format as seen in the figure to the right. Their differences are more dramatically displayed in the figure to the left which shows normalized contour plots for each of these three phases. This mode of representation provides a plot of the homogeneous line width (along f1) vs. the ESR spectrum (along f2), but is normalized with respect to the f1=0 slice. One sees that the Ld phase yields normalized contours representing the narrowest linewidths, whereas those from the gel phase represent the broadest. In addition, the normalized contours show distinctive patterns of line width variations across the spectrum. Publication: Y.-W. Chiang, A. Costa-Filho, and J.H. Freed, J. Magn. Reson., 188, 231-245 (2007); no PMCID |
||
|
||
|
Y.-W. Chiang, J.H. Freed (ACERT) A. J. Costa-Fihlo (Instituto de Física de São Carlos, Departamento de Física e Informática, Universidade de São Paulo, São Paulo, Brazil) |
||
|
|
About ACERT Contact Us |
Research |
Outreach |
ACERT is supported by grant 1R24GM146107 from the National Institute of General Medical Sciences (NIGMS), part of the National Institutes of Health. |
|||||
| ||||||||